Hybrid App Debugging – The Debug Window

In my last installment, I added support for a separate debug window on a separate thread from the main window thread. That way, I can pause the execution of the main window while the debug window stays responsive to user input. Now, let’s add some functionality to the debug window. I’m going to start by showing the source code of the python file being executed.

private void OnTraceback(TraceBackFrame frame, string result, object payload)
{
    FunctionCode code = (FunctionCode)frame.f_code;
    if (_curCode == null || _curCode.co_filename != code.co_filename)
    {
        _source.Inlines.Clear();
        foreach (var line in System.IO.File.ReadAllLines(code.co_filename))
        {
            _source.Inlines.Add(new Run(line + "rn"));
        }
    }

The TraceBackFrame instance has a property f_code that represents the FunctionCode object being executed in this frame. We have to explicitly cast to FunctionCode type because currently we’re exposing all properties that hang off TraceBackFrame as object type. Since Python is a dynamic language, we’re going to use reflection against the instance itself anyway so it doesn’t really matter what the return type is. However, I’ve asked Dino to change the TraceBackFrame type to use explicit types in order to make it easier to use SetTrace from statically typed languages like C#. Look for that in RC2.

After we cast the code object so it can be used from C#, we check to see if the currently loaded file matches the file currently loaded into the UI. I’ve ranted recently about the limitations of WPF’s TextBox but I didn’t want to get hung up syntax highlighting for this sample so I just went ahead and used the RichTextBox. In the DebugWindow Loaded event handler, I create _source as a WPF Paragraph and then wrap it in a FlowDocument and use it as the RichTextBox’s Document. I set the FlowDocument to be extremely wide, so as to avoid word wrapping. Then when I need to load a new source file, I clear _source of it’s current contents and add a single line run for every line of code in the file. This convention becomes useful later when I go to highlight the current line of code.

Once I load the current file, I save the current frame, code, result and payload in instance fields and then switch on result to determine what to do next. Currently, I’m just highlighting the relevant line of code and setting a TextBlock control in the menu bar.

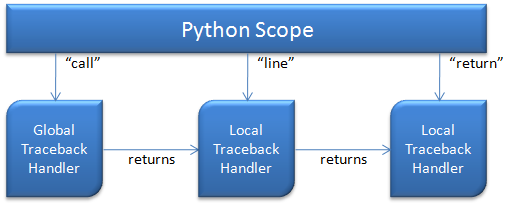
private void TracebackCall()
{
    dbgStatus.Text = string.Format("Call {0}", _curCode.co_name);
    HighlightLine((int)_curFrame.f_lineno,
        Brushes.LightGreen, Brushes.Black);
}

private void TracebackReturn()
{
    dbgStatus.Text = string.Format("Return {0}", _curCode.co_name);
    HighlightLine(_curCode.co_firstlineno,
        Brushes.LightPink, Brushes.Black);
}

private void TracebackLine()
{
    dbgStatus.Text = string.Format("Line {0}", _curFrame.f_lineno);
    HighlightLine((int)_curFrame.f_lineno,
        Brushes.Yellow, Brushes.Black);
}

In Visual Studio, we typically highlight the current line of code in yellow. However, that doesn’t work as great in a language like Python that delineates code blocks with whitespace. In ipydbg, I indicated function return with three carets. But I didn’t want to be modifying the text in the RichTextBox here so instead I used different colors for the different traceback event types: light green for call, light pink for return and yellow for line. The frame object contains the current line number, which I use for call and line, while the code object has the first line of the current code object, which I use for return. HighlightLine highlights the line in question with the colors provided and also scrolls that line into view if it isn’t already visible.

So now when a traceback is handled, it shows the text for the file being executed and highlights the appropriate line, based on the type of traceback event that happened. Now all we need is to have some way be able to continue execution. In the code, you’ll see I’ve defined a series of RoutedUICommands for common debugger commands. I’ve got the StepIn command wired up in the DebugWindow XAML to a menu item and the “S” keystroke. All that remains is to define StepInExecuted.

private void StepInExecuted(object sender, ExecutedRoutedEventArgs e)
{
    dbgStatus.Text = "Running";

    foreach (var i in _source.Inlines)
    {
        i.Background = rtbSource.Background;
        i.Foreground = rtbSource.Foreground;
    }

    _dbgContinue.Set();
}

This function does three basic things: changes the dbgStatus text, resets all the text in the RichTextBox back to the default coloring, and sets the _dbgContinue AutoResetEvent which signals the main window thread that’s been blocked in OnTracebackReceived to continue.

With this post, I’m about even with the code that’s up on GitHub. That code has a few other capabilities – notably it will stop tracing if you close the debug window and it supports StepOut command which disables traceback for the current scope by returning null in OnTracebackReceived. But I haven’t implemented things like:

  • Set Next Statement
  • Viewing and changing variables
  • Debugger REPL
  • Breakpoint Management

Any suggestions on which of those would you like to see next?

Hybrid App Debugging – Threading

I added traceback to my GetThings app in just two lines of code, but so far it doesn’t actually do anything that you would expect a debugger to do. But before we get to that, we need understand a little about how threading works for traceback debugging.

As I mentioned last time, the traceback debugger works by calling into the registered traceback handler at various times (entering/exiting a function, before executing a line of code and on exceptions). Execution of the Python code continues when the traceback function exits. That means that you have to block the execution thread while you let the user poke around with the debugger UI. For a console based app, that’s easy. For a GUI app, not so much.

At a minimum, you need to run your debugger UI on a separate thread from your main app window. If you want your main app window to be responsive while you debug, you’ll need to pump messages at a minimum (DoEvents in Windows Forms, similar approaches are available for WPF) or preferably run your python scripts on a background thread separate from either the main window UI thread or the debugger UI thread. To keep things simple, I’m going to simply block the main window thread while the debugger is active.

Since I’m going to have to setup a new thread for the debugger window, I decided to use a static constructor to centralize creating the thread, creating the window and registering the traceback handler all in one place.

static Thread _debugThread;
static DebugWindow _debugWindow;
static ManualResetEvent _debugWindowReady = new ManualResetEvent(false);

public static void InitDebugWindow(ScriptEngine engine)
{
    _debugThread = new Thread(() =>
    {
        _debugWindow = new DebugWindow(engine);
        _debugWindow.Show();
        Dispatcher.Run();
    });
    _debugThread.SetApartmentState(ApartmentState.STA);
    _debugThread.Start();

    _debugWindowReady.WaitOne();
    engine.SetTrace(_debugWindow.OnTracebackReceived);
}

As you can see, InitDebugWindow spins up a new thread and creates the debug window on that thread. Since it’s not the main WPF application thread, you have to explicitly call Dispatcher.Run to get the event queue pumping. You also have to explicitly set the apartment state to be single threaded for any threads creating WPF objects. Finally, I wait for the window to signal that it’s ready (it set’s the _debugWindowReady AutoResetEvent in the Window Loaded event) and then call SetTrace, passing in the debug window’s OnTracebackReceived event, on the thread that called InitDebugWindow.

It’s critical that you call SetTrace – and thus InitDebugWindow – on the thread that’s going to execute the Python code. Debugging in Python is per thread. Even if you execute the same code in the same ScriptScope with the same ScriptEngine but on a different thread, the traceback handler calls won’t fire. The way DebugWindow is written, it will only support debugging a single thread, but it would be pretty straightforward to support multiple threads by changing the way OnTracebackReceived gets signaled to continue.

Speaking of OnTracebackReceived, this was my initial basic implementation of it:

private TracebackDelegate OnTracebackReceived
    (TraceBackFrame frame, string result, object payload)
{
    Action<TraceBackFrame, string, object> tbAction = this.OnTraceback;
    this.Dispatcher.BeginInvoke(tbAction, frame, result, payload);
    _dbgContinue.WaitOne();
    return this.OnTracebackReceived;
}

As we saw, the DebugWindow is running on a different thread than the traceback handler call will come in on. So OnTracebackReceived needs to invoke a new call on the correct thread by using Dispatcher.BeginInvoke. Even though OnTracebackReceived is always called on the main window thread, it still has access to the properties of the debug window thread like its Dispatcher. I used BeginInvoke to invoke OnTraceback asynchronously – OnTraceback isn’t going to return anything interesting and we’re going to wait on an AutoResetEvent before continuing anyway so I didn’t see any reason to use a synchronous call.

We’ll discuss OnTraceback more next post, but basically it will configure the UI for the traceback event that happened. Then DebugWindow will wait for user input. When the user indicates they want to resume execution, the command handler in question will set _dbgContinue and the original traceback will return so execution can continue.

Hybrid App Debugging – TracebackDelegate and SetTrace

Now that I’ve introduced my simple hybrid GetThings app, we need to set about adding support for debugging just the IronPython part of the app via the new lightweight debugging functionality we’re introducing in 2.6. Note, the code is up on github, but isn’t going to exactly match what I show on the blog. Also, I have a post RC1 daily build of IronPython in the Externals folder since I discovered a few issues while building this sample that Dino had to fix after RC1. Those assemblies will be updated as needed as the sample progresses.

We saw last time how how easy it is to execute a Python script to configure a C# app – only four lines of code. If we want to support debugging, we need to add a fifth:

private void Window_Loaded(object sender, RoutedEventArgs e)
{
    ScriptEngine engine = Python.CreateEngine();
    engine.SetTrace(this.OnTraceback);

    ScriptScope s = engine.CreateScope();
    s.SetVariable("items", lbThings.Items);
    engine.ExecuteFile("getthings.py", s);
}

You’ll notice the one new line – the call to engine.SetTrace. This is actually an extension method – ScriptEngine is a DLR hosting API class and but SetTrace is IronPython specific functionality 1. If you look at the source of Python.SetTrace, you’ll see that it’s just a wrapper around SysModule.settrace, but it avoids needing to get the engine’s shared PythonContext yourself.

SetTrace takes a TracebackDelegate as a parameter. That delegate gets registered as the global traceback handler for the Python engine (on that thread, but we’ll ignore threading for now). Whenever that engine enters a new scope (i.e. a new function), the IronPython runtime calls into the global traceback handler. While the traceback handler runs, execution of the python code in that engine is paused. When the traceback handler returns, the engine resumes executing python code.

In addition to the global traceback handler, each scope has a local traceback handler as well. The TracebackDelegate type returns a TracebackDelegate which is used as the local traceback handler for the next traceback event within that scope. Traceback handlers can return themselves, some other TracebackDelegate, or null if they don’t want any more traceback events for the current scope. It’s kinda confusing, so here’s a picture:

You’ll notice three different traceback event types in the picture above: call, line and return. Call indicates the start of a scope, and is always invoked on the global traceback handler (i.e. the traceback passed to SetTrace). Line indicates the Python engine is about to execute a line of code and return indicates the end of a scopes execution. As you can see, the runtime uses the return value of the traceback for the next tracing call until the end of the scope. The return value from the “return” event handler is ignored.

So now that we know the basics of traceback handlers, here’s a simple TracebackDelegate that simply returns itself. The “Hello, world!” of traceback debugging if you will.

private TracebackDelegate OnTraceback
    (TraceBackFrame frame, string result, object payload)
{
    return this.OnTraceback;
}

If you run this code, there will be no functional difference from the code before you added the SetTrace call. That’s because we’re not doing anything in the traceback handler. But if you run this in the debugger with a breakpoint on this function, you’ll see that it gets called a bunch of times. In the python code from the last post, there are three scopes – module scope, download_stuff function scope and the get_nodes function scope. Each of those function scopes will have a call and return event, plus a bunch of line events in between.

The parameters for TracebackDelegate are described in the Python docs. The frame parameter is the current stack frame – it has information about the local and global variables, the code object currently executing, the line number being executed and a pointer to the previous stack frame if there is one. More information on code and frame objects is available in the python data model (look for “internal types”). Result is the reason why the traceback function is being called (in Python docs, it’s called “event” but that’s a keyword in C#). IronPython supports four traceback results: “call”, “line” and “return” as described above plus “exception” when an exception is thrown. Finally, the payload value’s meaning depends on the traceback result. For call and line, payload is null. For return, payload is the value being returned from the function. For exception, the payload is information about the exception and where it was thrown.

As I mentioned above, python code execution is paused while the traceback handler executes and then continues when the traceback handler returns. That means you need to block in that function if you want to let the user interact with the debugger. For a console app like PDB, you can do that with a single thread of execution easily enough. For a GUI app like GetThings, that means running the debugger and debugee windows on separate threads. And as I alluded to, tracing for Python script engines is per thread. So next time, we’ll look deeper into how to use multiple threads for lightweight debugging a hybrid app.


  1. Eventually, I’d like to see IronRuby support lightweight debugging as well. However, there’s no built in mechanism for Ruby debugging the way there is for Python, so it’s less clear how we should expose debugging to the Ruby developer. We’d also want to build a language neutral DLR Hosting API mechanism for lightweight debugging as well at that point. But honestly, we have higher priorities at this point.