Writing an IronPython Debugger: Getting Local Variables

I just pushed out a new drop of ipydbg that includes the first cut of support for showing local variables. Getting the value for a local variable is actually pretty simple. The CorFrame object (which hangs off active_thread) includes a method to get a local variable by index as well getting a count of all local variables. The problem with these functions is that they don’t provide the name of the variable. For that, you’ve got to look in debug symbols.

From a CorFrame, you can retrieve the associated CorFunction. Since I added symbol reader support to CorModule, I added support for directly retrieving the ISymbolMethod for a CorFunction. From the method symbols, I can get the root lexical scope of the method. And from the symbol scope, I can get the locals. Scopes can be nested, so to get all the locals for a given function, you need to iterate thru all the child scopes as well.

So here’s my get_locals function:

def get_locals(frame, scope=None, offset=None, show_hidden=False):  
    #if the scope is unspecified, try and get it from the frame

    if scope == None:  
        symmethod = frame.Function.GetSymbolMethod()  
        if symmethod != None:  
            scope = symmethod.RootScope  
        #if scope still not available, yield the local variables

        #from the frame, with auto-gen'ed names (local_1, etc)

        else:  
          for i in range(frame.GetLocalVariablesCount()):  
            yield "local_%d" % i, frame.GetLocalVariable(i)  
          return  

    #if we have a scope, get the locals from the scope  

    #and their values from the frame

    for lv in scope.GetLocals():  
        #always skip $site locals - they are cached callsites and  

        #not relevant to the ironpython developer

        if lv.Name == "$site": continue  
        if not lv.Name.startswith("$") or show_hidden:  
          v = frame.GetLocalVariable(lv.AddressField1)  
          yield lv.Name, v  

    if offset == None: offset = frame.GetIP()[0]  

    #recusively call get_locals for all the child scopes

    for s in scope.GetChildren():  
      if s.StartOffset <= offset and s.EndOffset >= offset:  
        for ret in get_locals(frame, s, offset, show_hidden):  
          yield ret

The function is designed to automatically retrieve the scope and offset, if they’re available. That way, I can simply call get_locals with the frame argument and it does the right thing. For example, if you don’t pass in a symbol scope explicitly get_locals will attempt to retrieve the debug symbols. If debug symbols aren’t available, iterates over the locals in the frame and yields each with a fake name (local_0, local_1, etc). If the debug symbols are available, then it iterates over the locals in the scope, then calls itself for each of the child scopes (skipping child scopes who’s offset range doesn’t overlap with the current offset).

The other feature of get_locals is deciding which locals to include. As you might expect, IronPython emits some local variables that are for internal runtime use. These variables get prefixed with a dollar sign. The dollar sign is not a legal identifier character in C# or Python, but IL has no problem with it. If you pass in False for show_hidden (or use the default value), then get_locals skips over any local variables who’s name starts with the dollar sign.

Even if you pass in True for show_hidden, get_locals still skips over any variable named “$site”. $site variables are dynamic call site caches, a DLR feature that are used to efficiently dispatch dynamic calls by caching the results of previous invocations. Martin Maly’s blog has more details on these caches. As they are part of method dispatch, I never want to show them to the ipydbg user, so they get skipped regardless of the value of show_hidden.

Now that I can get the local variables for a given frame, we need to convert those variables to something you can print on the screen. That turns out to be more complicated that you might expect, so it’ll have to wait for the next post (which may be a while, given that PyCon is this weekend). In the meantime, you can get the latest version of ipydbg from GitHub.
Writing an IronPython Debugger: A Little Hack…err…Cleanup

Yesterday, I pushed out two commits to ipydbg. The first was simple, I removed all of the embedded ConsoleColorMgr code in favor of the separate consolecolor.py module I blogged about Thursday. The second commit…well, let’s just say it’s not quite so simple.

Last weekend, I was experimenting with breakpoints when I discovered that the MoveNext method of BreakpointEnumerator was throwing a NotImplementedException. Up to that point, I hadn’t modified any of the MDbg C# source code except to merge the corapi and raw assemblies into a single assembly. But since I had to fix BreakpointEnumerator, I figured I should make some improvements to the C# code as well. For example, I added helper functions to easily retrieve the metadata for a class or function.

In my latest commit, I’ve added a SymbolReader property to CorModule. Previously, I managed the mapping from CorModules to SymbolReaders in my IPyDebugProcess class via the symbol_readers field. However, since mapping CorModules to SymbolReaders is something pretty much any debugger app would have to do, it made more sense to have that be a part of CorModule directly. So now, you can set and retrieve the SymbolReader directly on the module. Furthermore, I moved the logic to retrieve a SymbolReader from the IStream provided in the OnUpdateModuleSymbols event into the CorModule class as well.

I wouldn’t have bothered to blog this change at all, except that if you look at how the SymbolReader property is implemented under the hood, it’s not what you would expect. Instead of having SymbolReader as an instance variable on CorModule – as you might expect -CorModule has a static dictionary mapping CorModules to SymbolReaders. The instance SymbolReader property simply then access to the underlying static dictionary.

//code taken from CorModule class in CorModule.cs
private static Dictionary<CorModule, ISymbolReader> _symbolsMap = 
    new Dictionary<CorModule, ISymbolReader>();

public ISymbolReader SymbolReader
{
    get
    {
        if (_symbolsMap.ContainsKey(this))
            return _symbolsMap[this];
        else
            return null;
    }
    set
    {
        _symbolsMap[this] = value;
    }
}

Now obviously, this the way you typically implement properties. However, the problem is that there isn’t a 1-to-1 mapping between the underlying debugger COM object instances and the managed objects instances that wrap them. For example, if you look at the CorClass:Module property, it constructs a new managed wrapper for the COM interface it gets back from ICorDebugClass.GetModule. That means that I can’t store the symbol reader as an instance field in the managed wrapper since I probably will never see a given managed wrapper module instance ever again.

All of the debugger API wrapper classes including CorModule inherit from a class named WrapperBase which overrides Equals and GetHashCode. The overridden implementations defer to the wrapped COM interface, which means that two separate managed wrapper instances of the same COM interface will have the same hash code and will evaluate as equal. The upshot is that object uniqueness is determined by the wrapped COM object rather that the managed object instance itself.

Using a static dictionary to store a module instance property provides the necessary “it doesn’t matter what managed object instance you use as long as they all wrap the same COM object underneath” semantics. If I create multiple instances CorModule that all wrap the same underlying COM interface pointer, they’ll all share the same SymbolReader instance from the dictionary.

Yeah, it’s feels kinda hacky, but it works.

Writing an IronPython Debugger: Colorful Console

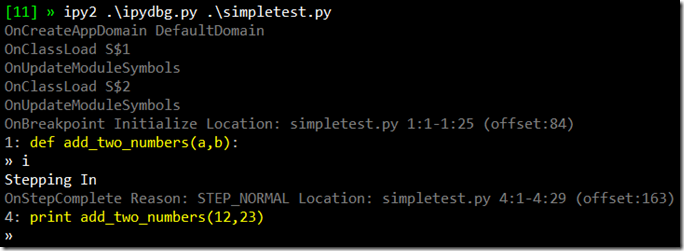
Now that I’ve added the current source code line to the console output, I wanted to start using color in order to make it clearer to understand the various pieces of data that gets output. Now, the various event handler messages get output in dark grey while the current line of source is in yellow. Here’s what it looks like on my machine (note, the top line with the green [11] is PowerShell and ipy2 is a PowerShell alias to ipy.exe v2.0.1)

ipydbg on the console

Writing color to the windows console is a hassle because of the stateful API it uses. The problem is that I always want to return to the default color after I’ve written out a line of colored text. I wish there was an overload of Console.Write and WriteLine that took the foreground and background colors as arguments.

Of course, I could easily implement my own write and writeline methods that took color parameters. However, I was loath to do that as Python’s print statement is so convenient. So instead, I build a console color context manager. I got the idea from Luis Fallas’ XmlWriter context manager.

class ConsoleColorMgr(object):  
  def __init__(self, color):  
    self.color = color  

  def __enter__(self):  
    self.temp = Console.ForegroundColor  
    Console.ForegroundColor = self.color  

  def __exit__(self, t, v, tr):  
    Console.ForegroundColor = self.temp  

CCDarkGray = ConsoleColorMgr(ConsoleColor.DarkGray)
CCGray     = ConsoleColorMgr(ConsoleColor.Gray)
CCYellow   = ConsoleColorMgr(ConsoleColor.Yellow)

def OnCreateAppDomain(self, sender,e):  
    with CCDarkGray:  
      print "OnCreateAppDomain", e.AppDomain.Name  
    e.AppDomain.Attach()

Python’s with statement is similar to C#’s using statement. However, unlike IDisposable object, Python context managers support both an enter and exit method. This means I don’t have to construct an object in order to get a context (in this case, the console colors) managed. So far, I’ve got three console color context managers defined – Grey, DarkGrey and Yellow. I’m thinking that ConsoleColorMgr is a candidate for my assorted module collection at some point.

Now that I can print in color, I wanted to modify my line printer to use color. Usually, the current sequence point corresponds to an entire line of python source. But as we see below, sometimes only part of a given line of source text is associated with a given sequence point.

The other issue I ran into is that there’s a always a sequence point at the very end of a function. Unlike the break at the start of the function I wrote about in my last post, this one I didn’t want to automatically step over. This is the last breakpoint for a given scope, so I should give the user one last chance to inspect the scope (once I add the ability to do that, at any rate) before we step out of it. However, I wanted a way of showing that we’re about to step out in the source code line view. I decided on writing a series of carets ^^^ to indicate that we’re at the end of a function.

As you can see in the dark grey line in the screenshot above, the current sequence point starts and ends at line 4 column 23. Column 23 is beyond the end of line 4, so that’s what I look for in order to draw the three carets. Here’s the final version of _print_source_line:

def _print_source_line(self, sp, lines):
  line = lines[sp.start_line-1]
  with CCGray:
    Console.Write("%d: " % sp.start_line)
    Console.Write(line.Substring(0, sp.start_col-1))
    with CCYellow:
      if sp.start_col > len(line):
        Console.Write(" ^^^")
      else:
        Console.Write(line.Substring(sp.start_col-1,
                                     sp.end_col - sp.start_col))
    Console.WriteLine(line.Substring(sp.end_col-1))

So colorizing the current line of source code turned out to be a little harder than I had expected. But hey, I got a start of a reusable module out of it. That’s pretty cool. Anyway, the latest bits are, as always, up on GitHub.

Writing an IronPython Debugger: Showing Source Code

It’s been almost a week since my last ipydbg post. I’m not done, I just needed to catch my breath for a few days and get some other work done. Contrary to popular believe, my day job revolves around more than just ipydbg! 😄

Actually, I’ve made ten commit since my last post, but it’s been a mostly minor changes. For example, I was hacking around with breakpoints and restored a bunch of commented out code in BreakpointEnumerator. Since I was changing the original C# CorDebug wrapper source, I decided to add a few helper functions to return metadata for functions and classes as well as cleaning up some C# filenames. On the Python side, I added an active_appdomain field to IPyDebugProcess to go along with active_thread.

Today, I added what started as a fairly minor feature – showing the current line of source code at the start of the input loop. The initial code for this was cake, simply getting the sequence point for the current location and mapping that to a source file. In order to avoid hitting the file system over and over, I cache source files the first time they are accessed.

def _get_file(self,filename):
    filename = Path.GetFileName(filename)
    if not filename in self.source_files:
      self.source_files[filename] = File.ReadAllLines(filename)
    return self.source_files[filename]  

def _input(self):
    offset, sp = self._get_location(self.active_thread.ActiveFrame)
    lines = self._get_file(sp.doc.URL)
    print "%d:" % sp.start_line, lines[sp.start_line-1]
    #input loop ommited for clarity

However, when I did this, I discovered a slight issue. When you step into a Python function, the CLR debugger breaks at the very beginning of the function being stepped into. In C#, the function start is mapped to the opening curly brace of the function. IronPython, on the other hand, doesn’t map the start of the function to anything since there’s a bunch of infrastructure code at the start of every function that has no correlation to the python source. This means _get_location return a null sequence point when I first step into a function and thus I wouldn’t be able to show any source code.

I could make the argument that start of the function should be mapped to the colon that starts the function block. However, I’m not in a position to make changes to how the shipping version of IronPython emits debug symbols. So instead, I decided to insert an automatic step whenever I step into a function by modifying OnStepComplete:

def OnStepComplete(self, sender,e):
    offset, sp = self._get_location(e.Thread.ActiveFrame)
    print "OnStepComplete Reason:", e.StepReason,
           "Location:", sp if sp != None else "offset %d" % offset
    if e.StepReason == CorDebugStepReason.STEP_CALL:
      self._do_step(e.Thread, False)
    else:
      self._do_break_event(e)

I have this nagging feeling that a simple step won’t suffice and I’ll need to add logic to ensure that I’m only auto-stepping when the start of the function doesn’t have a matching sequence point. But I have tested this with a few different python scripts and it appears to work fine. If I need something more sophisticated, I can always add it later. BTW, notice I modified the signature of _do_step so that it takes the thread as an argument rather than picking it up as an IPyDebugProcess field.

As usual, latest ipydbg (including new compiled version of CorDebug.dll) is available at GitHub.

Writing an IronPython Debugger: Debugging Just My Code

As I wrote last time, in order to make debug stepping actually useful in ipydbg I need to avoid stepping into frames that are part of the IronPython infrastructure. I did something similar when I hide infrastructure frames in the stack trace. Originally, I had planned to automatically stepping again if we ended up on a frame that didn’t correspond to a python file. However, Mike Stall showed me a much cleaner and better performing solution: Just My Code. As I mentioned at the start of this series, support for JMC is one of the main reasons I wanted to build my own debugger rather than use MDbg.

Enabling JMC in the stepper object is trivial:

def create_stepper(thread, JMC = True):
  stepper = thread.ActiveFrame.CreateStepper()
  stepper.SetUnmappedStopMask(CorDebugUnmappedStop.STOP_NONE)
  stepper.SetJmcStatus(JMC)  
  return stepper

If I make that single change and run ipydbg, any step effectively turns into a full continue since none of the code has been marked as “My Code” yet. As you see, the tricky part of JMC isn’t enabling it on the stepper, it’s “painting” the parts of the code where you want JMC stepping to work. You can set JMC status at the module, class or the method level. In the case of ipdbg, it’s easiest to work at the class level:

infrastructure_methods =  ['TryGetExtraValue',
    'TrySetExtraValue',
    '.cctor',
    '.ctor',
    'CustomSymbolDictionary.GetExtraKeys',
    'IModuleDictionaryInitialization.InitializeModuleDictionary']

def OnClassLoad(self, sender, e):
    cmi = CorMetadataImport(e.Class.Module)
    mt = cmi.GetType(e.Class.Token)
    print "OnClassLoad", mt.Name

    if not e.Class.Module.IsDynamic:
      e.Class.JMCStatus = False
    elif mt.Name.startswith('IronPython.NewTypes'):
      e.Class.JMCStatus = False
    else:
      e.Class.JMCStatus = True
      for mmi in mt.GetMethods():
        if mmi.Name in infrastructure_methods:
          f = e.Class.Module.GetFunctionFromToken(mmi.MetadataToken)
          f.JMCStatus = False

OnClassLoad is where the action is. This event handler is responsible for enabling JMC for all class methods that map to python code. To understand how the logic in OnClassLoad works, you need to understand a little about the .NET types and code that IronPython generates. Note, the following description is for the IronPython 2.0 branch. Code generation evolves from release to release and I know for a fact there are changes in the upcoming 2.6 version. I assume that I’ll eventually have to sniff the IronPython version in order to set JMC correctly.

Today, IronPython generates all code into dynamic modules and methods. Since I want to limit stepping to python code only, I automatically disable JMC for non-dynamic modules. I can imagine a scenario where I want to step into non-dynamically generated code, but I think the best way to handle that would be to disable JMC at the stepper rather than widening the amount of code marked as JMC enabled.

For every module that gets loaded, IronPython generates a type. At a minimum you’re going to load two modules: site.py and whatever python script you ran. If you have the python standard library installed, site.py loads a bunch of other modules as well. Each of these module types have a bunch of standard methods that always get generated. For example, the global scope code in the module is placed in a static method on the module type called Initialize. Any python functions you define get generated static methods with mangled names on the module type 1. All these methods have corresponding python code and should be JMC enabled. The other standard methods on a module type should not be JMC enabled. So in my debugger, I mark the class as JMC enabled but then iterate over the list of methods and mark any in the list of standard methods (except for Initialize) as JMC disabled.

Of course, you can also create classes in Python. As you might expect, classes in Python are generated as .NET types. However, the semantics of Python classes are very different than .NET types. For example, you can change the inheritance hierarchy of python classes at runtime. That’s obviously not allowed for .NET types. So the .NET types we generate have all the logic to implement Python class semantics. As it turns out, these .NET types only have the logic to implement Python class semantics, which is to say they have none of Python class methods code. This makes sense when you think about it – since Python can add and remove methods from a class at runtime, IronPython can’t put the method code in the .NET type itself. Instead, Python class methods are generated as static methods on the module type, just like top-level functions are. Since Python class types only contain Python class semantics logic, we never want to enable JMC for Python class types. Python class types get generated in the IronPython.NewTypes namespace, so it’s fairly easy to check the class name in OnClassLoad and automatically disable JMC for classes any in that namespace.

Adding JMC support makes ipydbg significantly more usable. It’s almost like a real tool now, isn’t it? Latest bits are up on GitHub.


  1. FYI, IronPython generates python functions as dynamic methods in release mode and static module class methods in debug mode since you can’t step into dynamic methods. The description above is specific to debug mode since ipydbg exclusively runs in debug mode.