CodeHTMLer Language Definition for Python

As I’ve blogged before, I use CodeHTMLer to post code snippets on my blog. I hear SyntaxHighlighter is the new hotness, but since it relies on CSS the syntax highlighting only appears on the website and not in the RSS reader.

The problem with CodeHTMLer is that it only supports a handful of languages out of the box. But the language definition file is simple enough – just an XML file with a bunch of regular expressions. When I was doing a lot of F# work, I wrote an F# language definition. Now that I’m on the IronPython team, go figure I’m writing a lot of code in Python. I *know* I’ve written a Python language definition for CodeHTMLer more than once, but I would forget to post it and then lose it when I paved my laptop hard drive. So after doing this three or four times, I’ve finally remembered to put it up on my SkyDrive.

If you want to install this yourself to colorize Python code snippets with CodeHTMLer, follow the directions I posted earlier with the F# language definition.

Writing an IronPython Debugger: Hello, Debugger!

Since I’m guessing most of my readers have never build a debugger before (I certainly hadn’t), let’s start with the debugger equivalent of Hello, World!

import clr
clr.AddReference('CorDebug')

import sys
from System.Reflection import Assembly
from System.Threading import AutoResetEvent
from Microsoft.Samples.Debugging.CorDebug import CorDebugger

ipy = Assembly.GetEntryAssembly().Location
py_file = sys.argv[1]
cmd_line = ""%s" -D "%s"" % (ipy, py_file)

evt = AutoResetEvent(False)

def OnCreateAppDomain(s,e):
  print "OnCreateAppDomain", e.AppDomain.Name
  e.AppDomain.Attach()

def OnProcessExit(s,e):
  print "OnProcessExit"
  evt.Set()

debugger = CorDebugger(CorDebugger.GetDefaultDebuggerVersion())
process = debugger.CreateProcess(ipy, cmd_line)

process.OnCreateAppDomain += OnCreateAppDomain
process.OnProcessExit += OnProcessExit

process.Continue(False)

evt.WaitOne()

I start by adding a reference to the CorDebug library I discussed at the end of my last post (that’s the low level managed debugger API plus the C# definitions of the various COM APIs). Then I need both the path to the IPy executable as well as the script to be run, which is passed in on the command line (sys.argv). For now, I just use Reflection to find the path to the current ipy.exe and use that. I use those to build a command line – you’ll notice I’m adding the –D on the command line to generate debugger symbols.

Next, I define two event handlers: OnCreateAppDomain and OnProcessExit. When the AppDomain is created, the debugger needs to explicitly attach to it. When the process exits, we signal an AutoResetEvent to indicate our program can exit.

Then it’s a simple process of creating the CorDebugger object, creating a process, setting up the process event handlers and then running the process via the call to Continue. We then wait on the AutoResetEvent for the debugged process to exit. And voila, you have the worlds simplest debugger in about 30 lines of code.

To run it, you run the ipy.exe interpreter and pass in the ipydbg script above and the python script to be debugged. You also have to pass –X:MTA on the command line, as the ICorDebug objects only work from a multi-threaded apartment. When you run it, you get something that looks like this:

» ipy -X:MTA ipydbg.py simpletest.py
OnCreateAppDomain DefaultDomain
35
OnProcessExit

Simpletest.py is a very simple script that prints the results of adding two numbers together. Here, you see the event handlers fire by writing text out to the console.

For those of you who’d like to see this code actually run on your machine, I’ve created an ipydbg project up on GitHub. The tree version that goes with this blog post is here. If you’re not running Git, you can download a tar or zip of the project via the “download” button at the top of the page. It includes both the CorDebug source as well as the ipydbg.py file (shown above) and the simpletest.py file. It also has a compiled version of CorDebug.dll, so you don’t have to compile it yourself (for those IPy only coders who don’t have VS on their machine).

Writing an IronPython Debugger: MDbg 101

Before I start writing any debugger code, I thought it would help to quickly review the .NET debugger infrastructure that is available as well as the design of the MDbg command line debugger. Please note, my understanding of this stuff is fairly rudimentary – Mike Stall is “da man” if you’re looking for a .NET debugger blogger to read.

The CLR provides a series of unmanaged APIs for things like hosting the CLR, reading and writing CLR metadata and – more relevant to our current discussion – debugging as well as reading and writing debugger symbols. These APIs are exposed as COM objects. The CLR Debugging API allows you to do those all the things you would expect to be able to do in a debugger: attach to processes (actually, app domains), create breakpoints, step thru code, etc. Of course, being an unmanaged API, it’s pretty much unavailable to be used from IronPython. Luckily, MDbg wraps this unmanaged API for us, making it available to any managed language, including IronPython.

The basic design of MDbg looks like this:

image

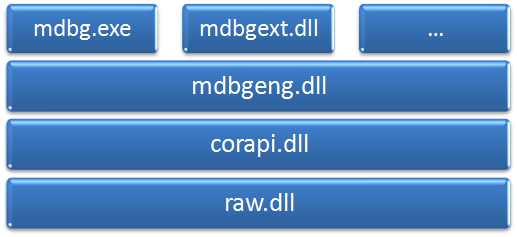
At the bottom is the “raw” assembly, which contains the C# definitions of the unmanaged debugger API – basically anything that starts with ICorDebug and ICorPublish. Raw also defines some of the metadata API, since that’s how type information is exposed to the debugger.

The next level up is the “corapi” assembly, which I refer to as the low-level managed debugger API. This is a fairly thin layer that translates the unmanaged paradigm into something more palatable to managed code developers. For example, COM enumerators such as ICorDebugAppDomainEnum are exposed as IEnumerable types. Also, the managed callback interface gets exposed as .NET events. It’s not perfect – the code is written in C# 1.0 style so there are no generics or yields.

Where corapi is the low-level API, “mdbgeng” is the high-level managed debugger API. As you would expect, it wraps the low-level API and provides automatic implementations of common operations. For example, this layer maintains a list of breakpoints so you can create them before the relevant assembly has been loaded. Then when assemblies are loaded, it goes thru the list of unbound breakpoints to see if any can be bound. It’s also this layer that automatically creates the main entrypoint breakpoint.

Finally, at the top we have the MDbg application itself, as well as any MDbg extensions (represented by the … in the diagram above). The mdbgext assembly defines the types shared between MDbg.exe and the extension assemblies. MDbg has some cool extensions – including an IronPython extension – but for now I’m focused on building something as lightweight as possible, so I’m going to forgo an extensibility mechanism, at least for now.

My initial prototype was written against the high-level API. There were two problems with this approach. The first is that there’s no support for Just My Code in the high-level API. As I mentioned in my last post, JMC support is critical for this project. Adding JMC support isn’t hard, but I’m trying to make as few changes as possible to the MDbg source, since I’m not interested in forking and maintaining that code. Second, while the low-level API provides an event-based API (OnModuleLoad, OnBreakpoint, OnStepComplete, etc), the high-level API provides a more console-oriented looping API. I found the event-driven API to be cleaner to work with and I’m thinking it will work better if I ever build a GUI version of ipydbg. So I’ve decided to work against the low-level API (aka corapi).

I mentioned above that I didn’t want to change the MDbg source, but I did make one small change. The separation of corapi and raw into two separate assemblies is an outdated artifact of an earlier version of MDbg. So I decided to combine these two into a single assembly called CorDebug. Other than some simple cleanup to assembly level attributes to make a single assembly possible, I haven’t changed the source code at all.

Writing an IronPython Debugger: Introduction

A while back I showed how you can use Visual Studio to debug IronPython scripts. While that works great, it’s lots of steps and lots of mouse work. I yearned for something lighter weight and that I could drive from the command line.

The .NET framework includes a command line debugger called MDbg, but after using it for a bit, I found it didn’t like it very much for IronPython debugging. Mdbg automatically sets a breakpoint on the main entrypoint function, but only if it can find the debugging symbols. So when you use Mdbg with the released version of IPy, the breakpoint never gets set. Instead, you have to trap the module load event, set a breakpoint in the python file you’re debugging, then stop trapping the module load event. Every Time. That gets tedious.

Another problem with MDbg is that it’s not Just-My-Code (aka JMC) aware. JMC is this awesome debugging feature that was introduced in .NET 2.0 that lets the debugger “paint” the parts of the code that you want to step thru (aka “My Code”). By default, Visual Studio marks code with symbols as “my code” and code without symbols as “not my code”. 1 We don’t ship symbols with IronPython releases, so Visual Studio does only steps thru the python code. MDbg doesn’t support JMC, so I often found myself stepping into random parts of the IronPython implementation. That’s even more tedious.

Luckily, the source code to MDbg is available. So I got the wacky idea to build a debugger specifically for IronPython. CPython includes pdb (aka Python Debugger, not Program Database) but we don’t support it because we haven’t implementedsettrace. Thus, ipydbg was born.

Over the course of this series of blog posts, I’m going to build out ipydbg. I have built out a series of prototypes so I fairly confident that I know how to build it. However, I’m not sure what it will look like at the end. If you’ve got any strong opinions on it one way or the other, be sure to email me or leave me comments.

BTW, major thanks to my VSL teammate Mike Stall (of Mike Stall’s .NET Debugging Blog). Without his help, I would probably still be trying to make heads or tails of the MDbg source.


  1. VS uses the DebuggerNonUserCode attribute to provide fine grained control of what is considered “my code” and should be stepped thru.

Avalanche 4, Caps 1

“We had nothing; we were horrible out there,” Boudreau snapped. “Everybody had their bad game at the same time. You win a lot of games in a row, you’re going to have a stinker. Today was it.”
Capitals Insider

Boy, it’s much more fun to write a Caps wrapup when they win.

Honestly, the less said about this game, the better. I said at both intermissions that the Caps were lucky to be tied/down by only one, and the third period proved me right. Honestly, if I didn’t know the players and the teams, I wouldn’t have been able to tell which team was #2 in the East and which team was #15 in the West.

The only good things I can say about this game are:

  1. Perfect on the penalty kill, including 43 seconds of 5-on-3
  2. Backstrom’s goal was nice
  3. Much better on faceoffs – as a team, we won 60% of them. Only Nylander was below 50%. Steckel won 9 of 10
  4. Err, did I mention the Caps were perfect on the PK?

Japers pointed out that “the frequency with which these “efforts” are happening that is more than a little disconcerting.” After last night’s effort plus the 3rd period effort against Montreal, “more than a little disconcerting” is spot on.

Next up, Caps play the Penguins tomorrow. The Pens just beat the Flyers 5-4. I didn’t see the whole game but Biron totally botched the play that lead to the Pens game winning goal. So we have the Pens riding a big win and the Caps coming off a lackluster performance on national TV. Should be interesting to say the least. Unfortunately, I’ve got a morning flight home to Seattle tomorrow, so I’m going to miss it.