Now that I’ve introduced my simple hybrid GetThings app, we need to set about adding support for debugging just the IronPython part of the app via the new lightweight debugging functionality we’re introducing in 2.6. Note, the code is up on github, but isn’t going to exactly match what I show on the blog. Also, I have a post RC1 daily build of IronPython in the Externals folder since I discovered a few issues while building this sample that Dino had to fix after RC1. Those assemblies will be updated as needed as the sample progresses.
We saw last time how how easy it is to execute a Python script to configure a C# app – only four lines of code. If we want to support debugging, we need to add a fifth:
private void Window_Loaded(object sender, RoutedEventArgs e)
{
    ScriptEngine engine = Python.CreateEngine();
    engine.SetTrace(this.OnTraceback);

    ScriptScope s = engine.CreateScope();
    s.SetVariable("items", lbThings.Items);
    engine.ExecuteFile("getthings.py", s);
}
You’ll notice the one new line – the call to engine.SetTrace. This is actually an extension method – ScriptEngine is a DLR hosting API class and but SetTrace is IronPython specific functionality 1. If you look at the source of Python.SetTrace, you’ll see that it’s just a wrapper around SysModule.settrace, but it avoids needing to get the engine’s shared PythonContext yourself.
SetTrace takes a TracebackDelegate as a parameter. That delegate gets registered as the global traceback handler for the Python engine (on that thread, but we’ll ignore threading for now). Whenever that engine enters a new scope (i.e. a new function), the IronPython runtime calls into the global traceback handler. While the traceback handler runs, execution of the python code in that engine is paused. When the traceback handler returns, the engine resumes executing python code.
In addition to the global traceback handler, each scope has a local traceback handler as well. The TracebackDelegate type returns a TracebackDelegate which is used as the local traceback handler for the next traceback event within that scope. Traceback handlers can return themselves, some other TracebackDelegate, or null if they don’t want any more traceback events for the current scope. It’s kinda confusing, so here’s a picture:
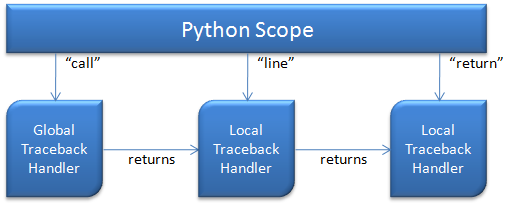
You’ll notice three different traceback event types in the picture above: call, line and return. Call indicates the start of a scope, and is always invoked on the global traceback handler (i.e. the traceback passed to SetTrace). Line indicates the Python engine is about to execute a line of code and return indicates the end of a scopes execution. As you can see, the runtime uses the return value of the traceback for the next tracing call until the end of the scope. The return value from the “return” event handler is ignored.
So now that we know the basics of traceback handlers, here’s a simple TracebackDelegate that simply returns itself. The “Hello, world!” of traceback debugging if you will.
private TracebackDelegate OnTraceback
    (TraceBackFrame frame, string result, object payload)
{
    return this.OnTraceback;
}
If you run this code, there will be no functional difference from the code before you added the SetTrace call. That’s because we’re not doing anything in the traceback handler. But if you run this in the debugger with a breakpoint on this function, you’ll see that it gets called a bunch of times. In the python code from the last post, there are three scopes – module scope, download_stuff function scope and the get_nodes function scope. Each of those function scopes will have a call and return event, plus a bunch of line events in between.
The parameters for TracebackDelegate are described in the Python docs. The frame parameter is the current stack frame – it has information about the local and global variables, the code object currently executing, the line number being executed and a pointer to the previous stack frame if there is one. More information on code and frame objects is available in the python data model (look for “internal types”). Result is the reason why the traceback function is being called (in Python docs, it’s called “event” but that’s a keyword in C#). IronPython supports four traceback results: “call”, “line” and “return” as described above plus “exception” when an exception is thrown. Finally, the payload value’s meaning depends on the traceback result. For call and line, payload is null. For return, payload is the value being returned from the function. For exception, the payload is information about the exception and where it was thrown.
As I mentioned above, python code execution is paused while the traceback handler executes and then continues when the traceback handler returns. That means you need to block in that function if you want to let the user interact with the debugger. For a console app like PDB, you can do that with a single thread of execution easily enough. For a GUI app like GetThings, that means running the debugger and debugee windows on separate threads. And as I alluded to, tracing for Python script engines is per thread. So next time, we’ll look deeper into how to use multiple threads for lightweight debugging a hybrid app.
-
Eventually, I’d like to see IronRuby support lightweight debugging as well. However, there’s no built in mechanism for Ruby debugging the way there is for Python, so it’s less clear how we should expose debugging to the Ruby developer. We’d also want to build a language neutral DLR Hosting API mechanism for lightweight debugging as well at that point. But honestly, we have higher priorities at this point.↩